The GSA Image Analyser is a professional, high-precision 2D image analysis software designed to automate object counting, batch particle separation, and spatial measurements.

Whether you are analyzing complex microscopic cell cultures, measuring root lengths via the Tennant method, or performing digital color mapping for quality control, this powerful tool eliminates tedious manual labor.

Engineered for scientists, laboratories, and B2B industrial researchers, the software seamlessly processes high-resolution imagery from files, scanners, microscopes, and live cameras.

Export publication-ready statistics instantly and optimize your workflow with a true Lifetime License-meaning zero monthly subscription fees, zero recurring costs, and 100% free lifetime updates.

  • Automated Particle & Cell Counting: Save hours of manual labor with an AI-assisted engine that identifies, segments, and counts thousands of cells or particles in seconds.
  • Smart Overlap Separation (Clustering Mitigation): Accurately detect and individualize overlapping cells or objects that traditional counters fail to split.
  • Precision Spatial & Length Measurement: Calculate direct object lengths, centerlines, and complex perimeters with high pixel-to-micrometer accuracy.
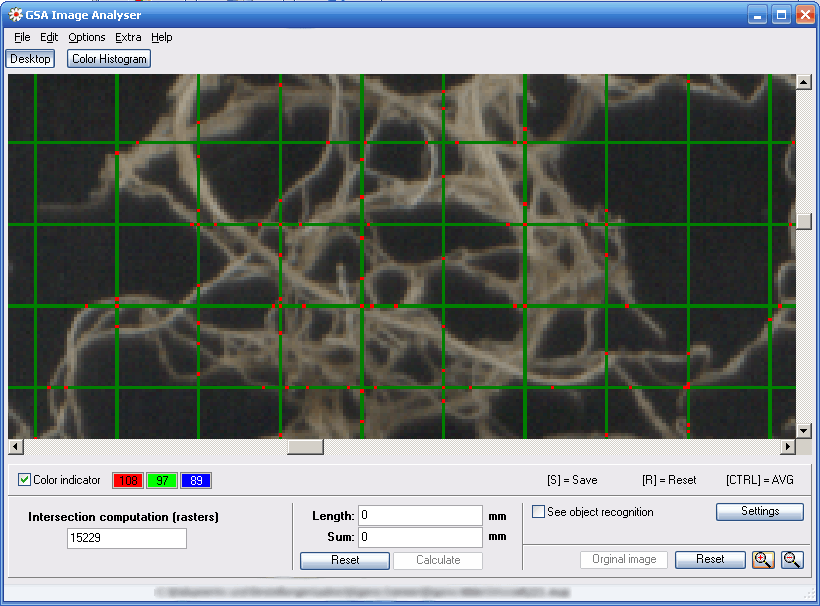
  • Digital Tennant Root Mapping: Automate the gold-standard Tennant method for agricultural and botanical root-system analysis without manual grid crossing.
  • One-Click Statistical Export: Instantly compile area size distributions, shapes, and counts into publication-ready CSV, Excel, or PDF formats.
  • Chromatic & Color Percentage Mapping: Extract exact RGB/Hex color distribution percentages-perfect for chemical assays, material degradation tests, and foliage analysis.
  • Multi-Channel Color Histograms: Generate precise graphical breakdowns of image channels for deep statistical and material evaluations.
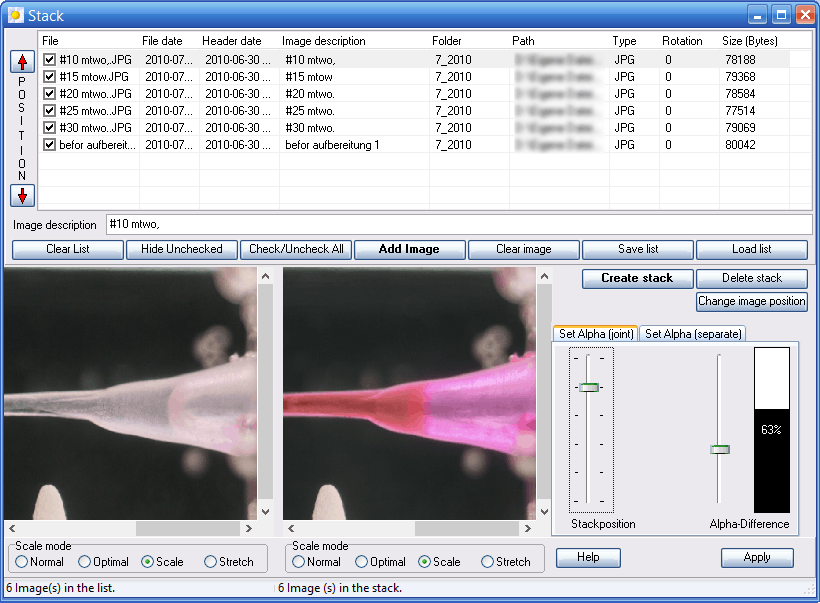
  • Time-Lapse Image Stacking: Layer chronological images from identical coordinates to visually track growth, decay, or movement over time.
  • Integrated Pre-Processing Filter Toolbox: Wipe out image noise, uneven microscope lighting, or lens dust before counting to ensure flawless data accuracy.
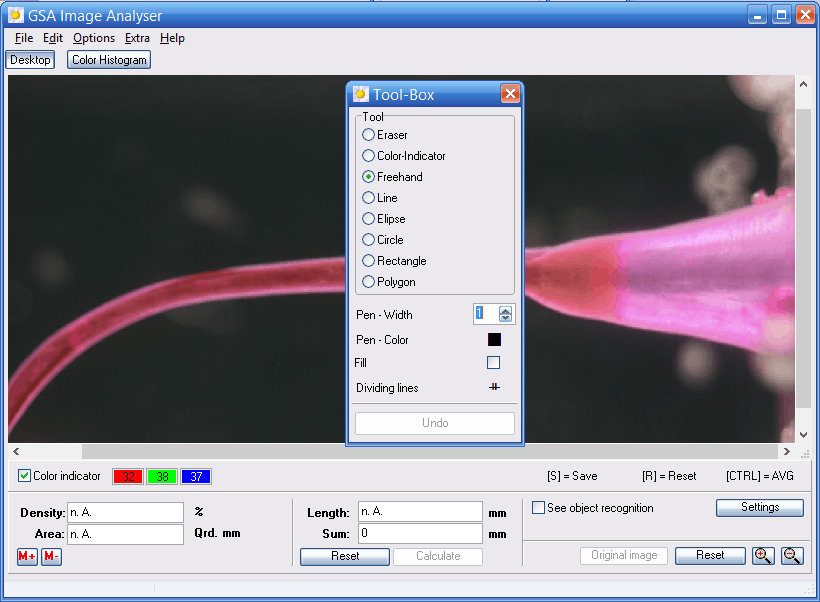
  • Built-In Regional Image Editor: Crop, isolate Regions of Interest (ROI), or manually retouch artifacts directly inside the software without buying third-party photo editors.
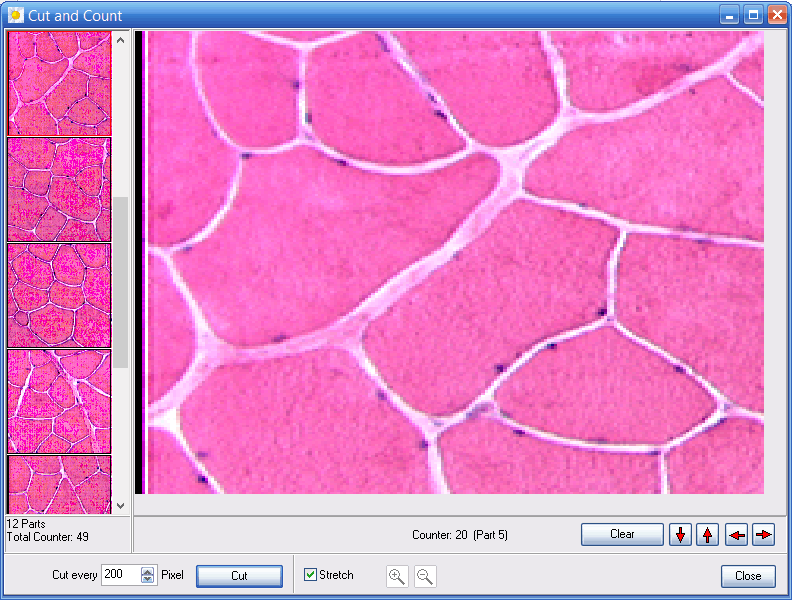
  • High-Resolution Grid Sectioning ("Cut & Count"): Automatically divide massive, gigapixel images into smaller sectors to systematically manage manual verification.
  • True Lifetime License: Eliminate recurring software-as-a-service (SaaS) fees. Pay once, own it forever, and protect your lab's annual budget.
  • 100% Free Lifetime Updates: Benefit from continuous feature enhancements and bug fixes without ever facing hidden upgrade costs.
  • Cross-Platform Flexibility: Optimized for all Windows OS and VPS environments; runs seamlessly on macOS and Linux via Parallels, Wine, or Virtual Machines.
  • First-Class Developer Support: Get direct access to technical support and an active global user forum to resolve workflow bottlenecks immediately.
Cell Count Automatically Part1

Automated Object Counting & Particle Analysis
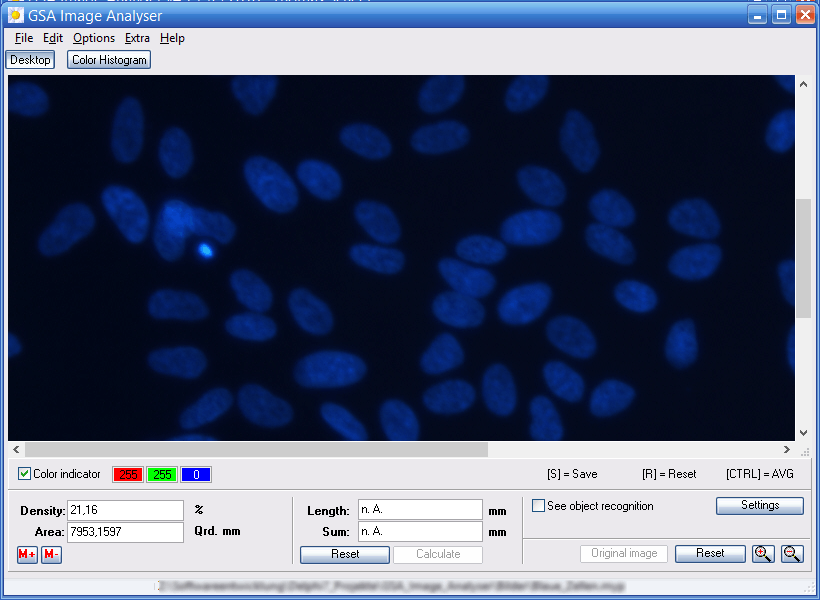
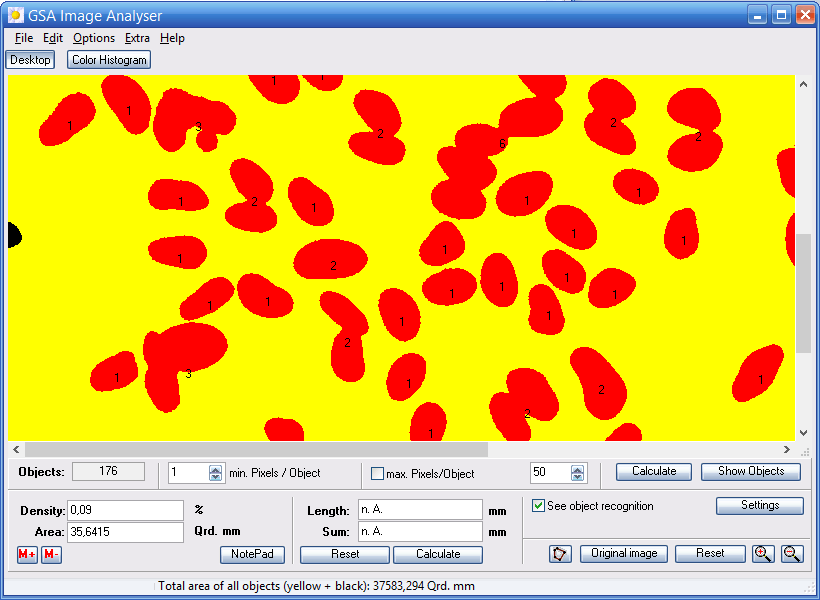
Manually counting cells, particles, or micro-structures is time-consuming and prone to human error. Our automated recognition system processes complex images within seconds, eliminating tedious manual labor while delivering reliable, reproducible counts for laboratory and industrial applications.

Advanced Object Visualization & Overlap Detection

Evaluate your automated counting results directly within the user interface. Thanks to advanced image processing algorithms, the software accurately detects and segregates overlapping or clustered cells, highlighting every counted entity with clear, colored boundaries for easy visual verification.
Cell Count Automatically Part4
Cell Count Automatically Part2

Fine-Tune Your Detection with Flexible Recognition Options
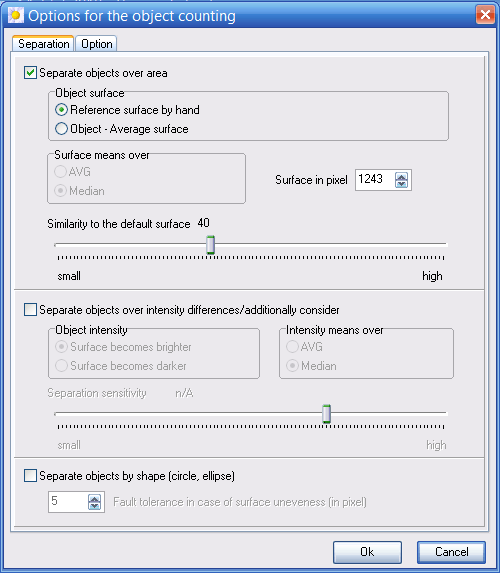
Adapt the automated object recognition engine to your specific sample types. With flexible filtering adjustments for size, threshold, shape factor, and contrast, you can fine-tune the detection parameters to ensure that only the relevant structures are included in your count.

Comprehensive Object Statistics for Scientific Research

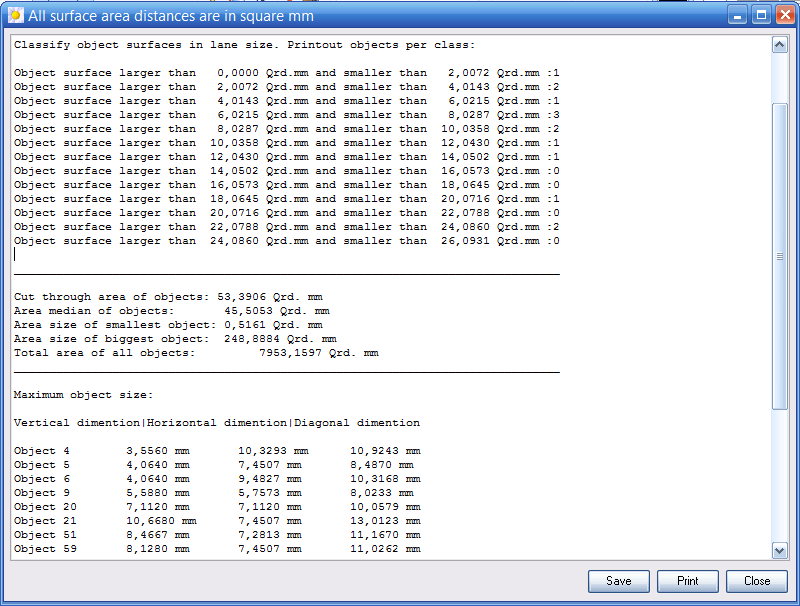
Export rich, publishable data directly from your analysis. The program automatically compiles comprehensive statistical datasets-including area size distributions, particle dimensions, and perimeter measurements-ready to be used in your research papers, Excel sheets, or laboratory reports.
Cell Count Automatically Part3
Plant Root Object Recognition In Process

Intelligent Image Segmentation & Parameter Filtering
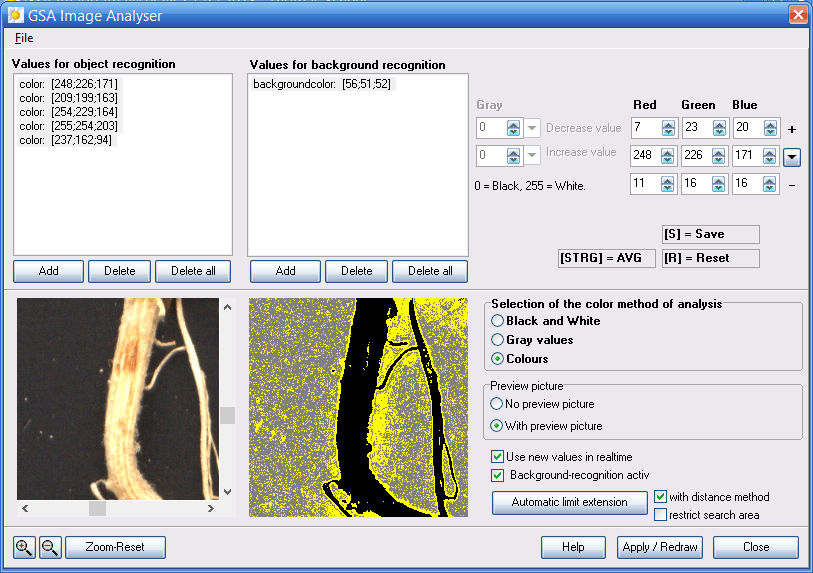
Isolate target structures from complex backgrounds with precision. By applying customized multi-parameter filters, you can easily exclude debris, dust, or unwanted image artifacts, ensuring that the software isolates and measures only the specific objects your study requires.

Smart Search Tools for Outlier & Feature Detection

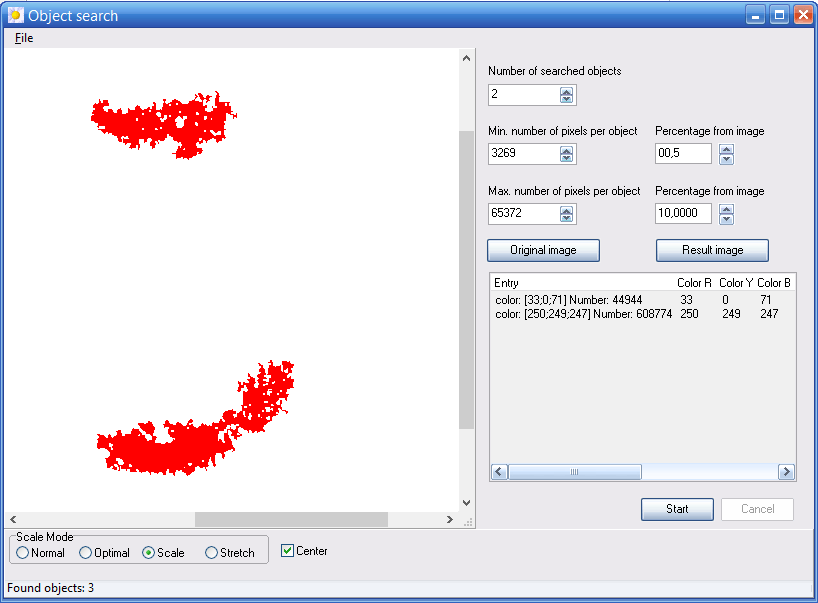
Locate specific data points or anomalies effortlessly. Once the automated recognition process is complete, the integrated search and sort functions allow you to filter for structural outliers, unique cell shapes, or specific size ranges that stand out from the rest of the sample.
Object Search
Cell Counting Manually Part1

Manual Counting & Interactive Marking Tools
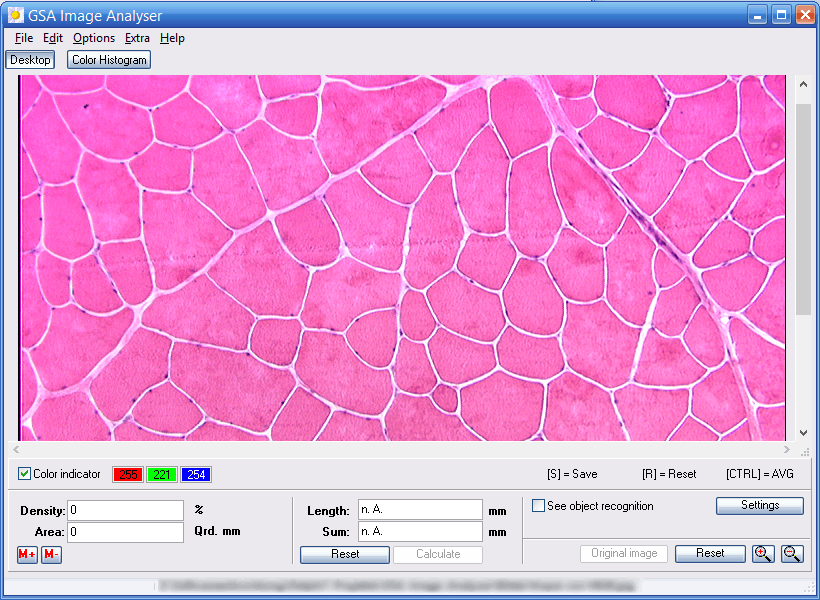
For highly irregular samples or complex microscopic frames that defy automation, the software offers a digital manual counting workstation. Seamlessly tag items with a single click, keeping your workflow organized without losing track of your progress.

Cut and Count: High-Resolution Grid Sectioning

Simplify the evaluation of massive, high-resolution imagery. The built-in grid sectioning tool cuts large images into smaller, manageable sectors, enabling systematic step-by-step counting and reducing cognitive fatigue during extended analysis sessions.
Cell Counting Manually Part2
Termites Manual Counting

Avoid Double Counting with Smart Checkmarks
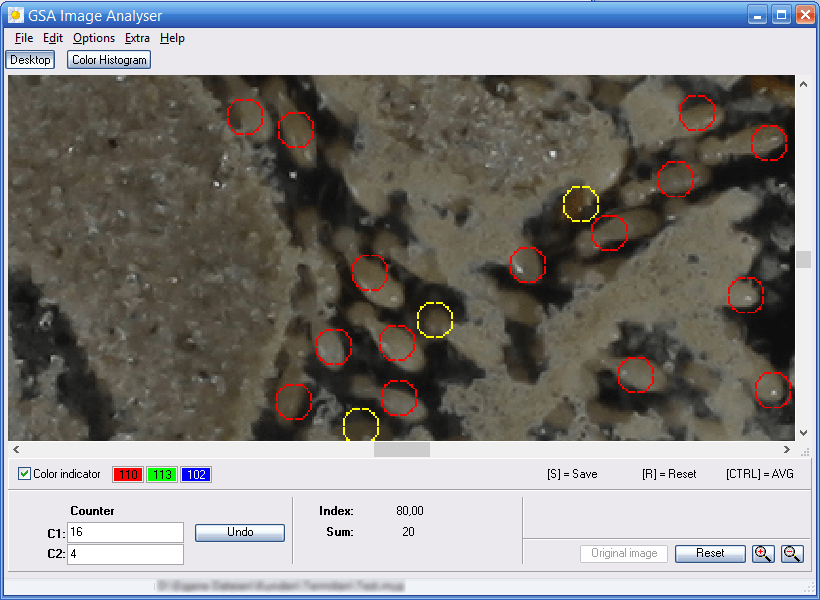
Maintain perfect accuracy on dense specimen slides. Placing a digital mark on an object dynamically increments the counter while visually labeling the item, completely preventing the risk of double counting smaller structures or closely packed cells.

Automated Root Length Measurement via Tennant Method

Execute the well-established Tennant method digitally and effortlessly. The software automatically overlays grid intersections to calculate comprehensive root systems, saving botanical and agricultural researchers hours of manual microscopic tracking.
Object Length Calculation Tennant
Object Length Calculation

Direct Length Calculation & Precise Spatial Measurement
Measure the true physiological length of curved or linear objects using our direct tracking algorithm. By tracing the internal centerline and mapping the outer contours, this digital method delivers significantly higher spatial accuracy than traditional grid-intersection techniques.

Time-Lapse Analysis & Dynamic Image Stacking

Track structural evolution over time by utilizing the image stack feature. By aligning multiple images taken from the same coordinate over days or hours, you can visually loop through layers or adjust transparency to pinpoint exactly what changed within your sample.
Create Image From Stack
Image Processing Filter

Pre-Processing Filters for Noise Reduction & Contrast Enhancement
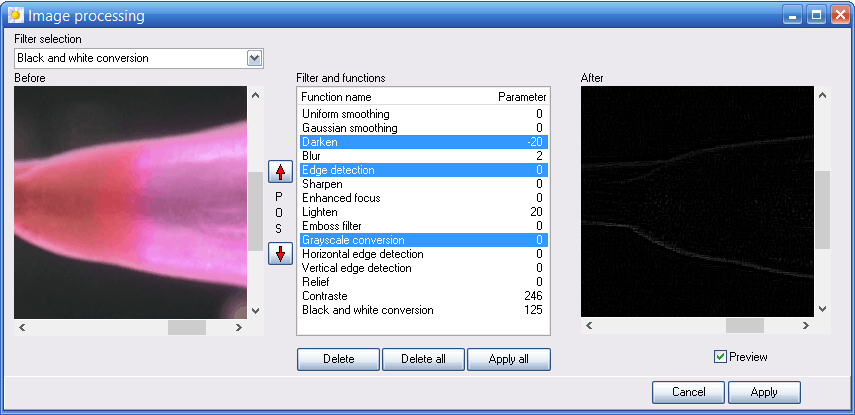
Optimize your raw image quality prior to analysis. The integrated digital filter toolbox lets you apply background flattening, sharpening, and contrast enhancements, effectively wiping out image noise, lens dust, or sub-optimal lighting conditions.

Integrated Image Editor for Manual Retouching

Modify your image assets directly within the software workspace. Paint, crop, or erase elements manually to isolate regions of interest (ROI) without needing to export files to clunky, external third-party photo editing suites.
Image Processing Tool Box
Color Analysis

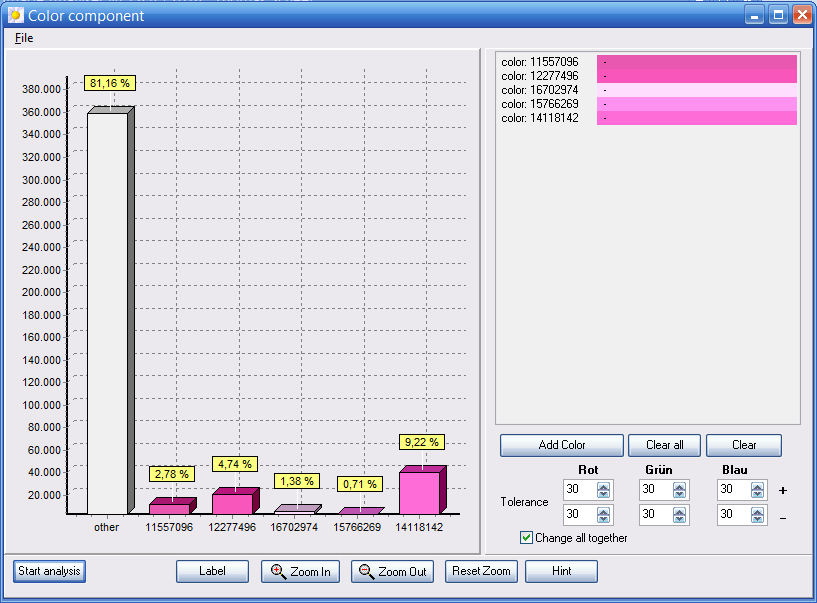
Advanced Color Analysis & Digital Chromatic Mapping
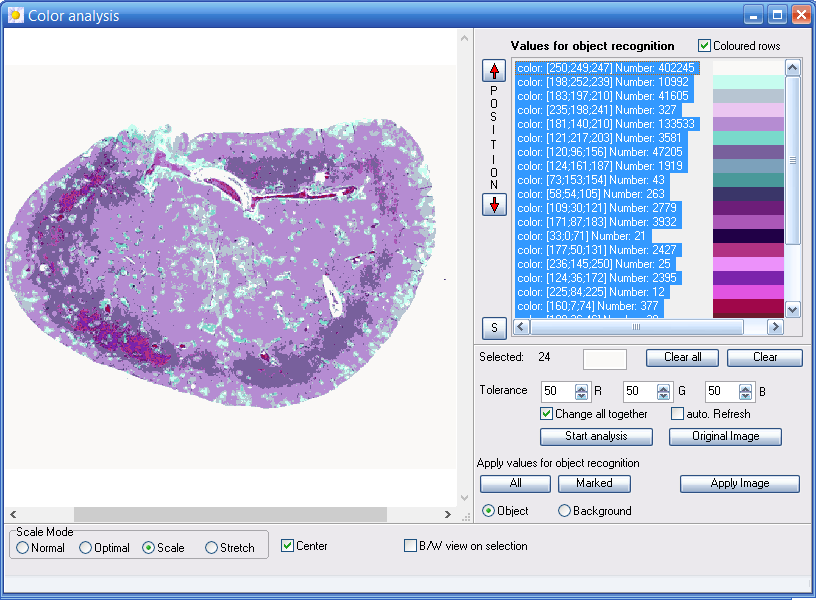
Analyze surface color distributions with scientific precision. The software scans designated pixel ranges to calculate the exact percentage of color variations compared to the total image surface, which is ideal for quality control, chemical assays, or foliage analysis.

Multi-Channel Color Components & Automated Charts

Convert complex chromatic data into clear visual assets. With the click of a button, the system generates comprehensive color mapping charts and breakdown diagrams, allowing you to instantly visualize multi-channel color data for your documentation.
Color Component
Color Histogram

Detailed Color Histograms for Statistical Evaluation
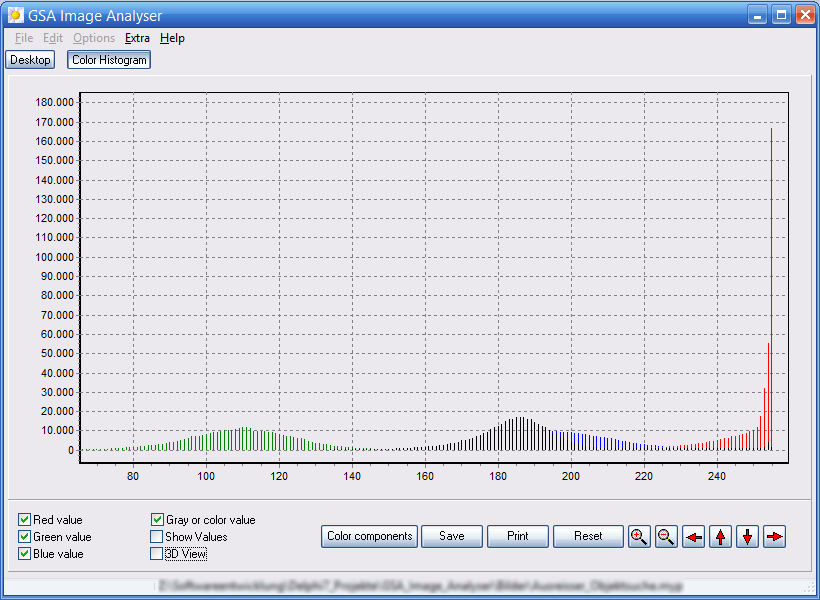
Gain deeper insights into your image data through high-resolution color histograms. Review the exact distribution of red, green, and blue (RGB) channels to identify subtle chemical reactions, surface degradation, or material composition changes.

Product Comparison: GSA Image Analyser vs. Industry Alternatives

Choosing the right tool is essential for your analysis. Below is a direct comparison showing how GSA Image Analyser stack up against other popular tools on the market.

Feature / MetricGSA Image AnalyserSubscription-Based CompetitorsTraditional Open-Source Tools
Pricing ModelLifetime License (Pay once, own forever)Recurring monthly/annual subscription feesFree (but hidden costs in setup & training)
Hidden / Upgrade CostsNone ($0 permanently)Paid upgrades for new versions & featuresNone
Automatic Cell CountingYes, with smart overlap separationYes, often locked behind premium tiersRequires complex manual macro scripting
Tennant Root AnalysisBuilt-in, automated featureRarely supported nativelyRequires third-party plugins
Data & Reports ExportOne-click export (Publication-ready CSV/Excel)YesFragmented formats, requires manual formatting
Learning CurveLow (Intuitive GUI & direct image source import)Medium to HighExtremely high (Requires programming/coding skills)
Software Updates100% Free Lifetime UpdatesIncluded only during active subscriptionIrregular, community-dependent updates
Customer SupportFirst-class direct email support & active forumSlow ticketing systems or premium-only supportNo official support (Forums only)
Operating SystemWindows, VPS (macOS/Linux via VM/Parallels)Varies by providerVaries, setup often unstable on newer OS

GSA Image Analyser - FAQ


What is GSA Image Analyser used for?


The GSA Image Analyser is a professional 2D image analysis software used to automate object counting, particle recognition, and spatial measurements. It is widely utilized in scientific research, medical laboratories, botany, and industrial quality control to replace manual counting workflows with fast, reproducible, and digital data analysis.

Can the software accurately count overlapping cells?


Yes. The software features an advanced object visualization and segmentation engine designed specifically to detect and separate overlapping or clustered cells and particles. By fine-tuning the threshold, size filters, and recognition options, it achieves high precision even on dense microscopic specimen slides.

What is the Tennant method in GSA Image Analyser?


The Tennant method is a globally recognized grid-intersection technique used to calculate the length of complex root systems. GSA Image Analyser digitizes and automates this process. Instead of manually counting intersections under a microscope, botanical and agricultural researchers can map and calculate root lengths within seconds.

Which image sources and file formats are supported?


You can import images into the software from almost any digital source, including high-resolution image files, flatbed scanners, digital microscopes, and live laboratory cameras. It supports standard formats to ensure seamless integration into your existing laboratory infrastructure.

Can I export the counting data and statistics for research papers?


Yes. The program automatically compiles comprehensive statistical datasets, including area size distributions, perimeters, and particle counts. You can export these reports with a single click into publication-ready formats such as CSV or Excel, making them instantly available for your scientific papers or laboratory documentation.

Does GSA Image Analyser require a monthly subscription?


No. GSA Image Analyser operates on a true Lifetime License model. There are no monthly subscription fees, no hidden service charges, and zero recurring payments. You buy the software once, own it forever, and protect your department's annual software budget.

Are future software updates free?


Yes. All future updates, performance enhancements, and new feature releases are 100% free of charge for lifetime license holders. There are no paid upgrade tiers, ensuring you always have access to the latest version of the application.

Does the software run on macOS or Linux?


GSA Image Analyser is natively optimized for all Windows OS and Windows VPS environments. However, cross-platform users in research laboratories can seamlessly run the software on macOS or Linux utilizing virtual environments such as Parallels, Wine, or a standard Virtual Machine (VM).

GSA Image Analyser - Reviews & User Testimonials