Advanced Pathway Painter
Display pathways for gene/protein experiments
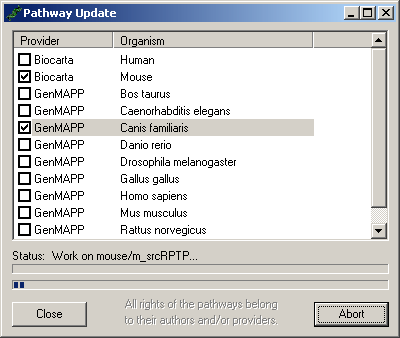
This program visualizes pathways. The user can display any kind of quantitative data from gene and protein experiments directly within the pathways (colours represent the value). Automatic pathway update from KEGG, BioCarta and GenMAPP.
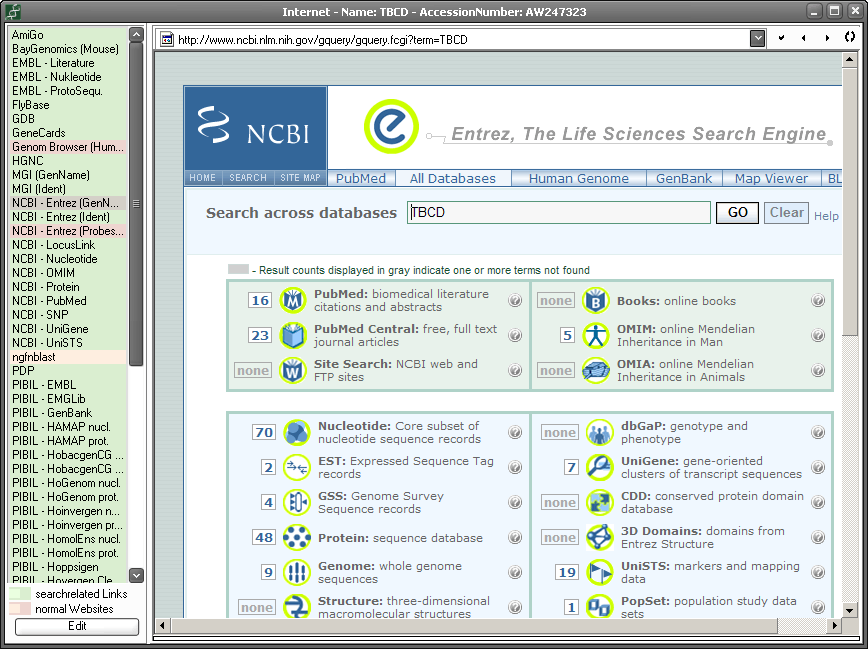
This freeware program visualizes pathways (KEGG, GenMAPP, BioCarta...). The user has the possibility to display any kind of quantitative data from gene and protein experiments (e.g. microarrays from Affymetrix) directly within the pathways (colors represent the value). The linking between the pathway items and the experiment data is done over the gene or protein names and their accession numbers. Furthermore, the user has a quick overview on the gene/protein with the collected links in the web-interface (direct links).
This program includes only a small part of the functions from the software GENOM 2005.
This program includes only a small part of the functions from the software GENOM 2005.
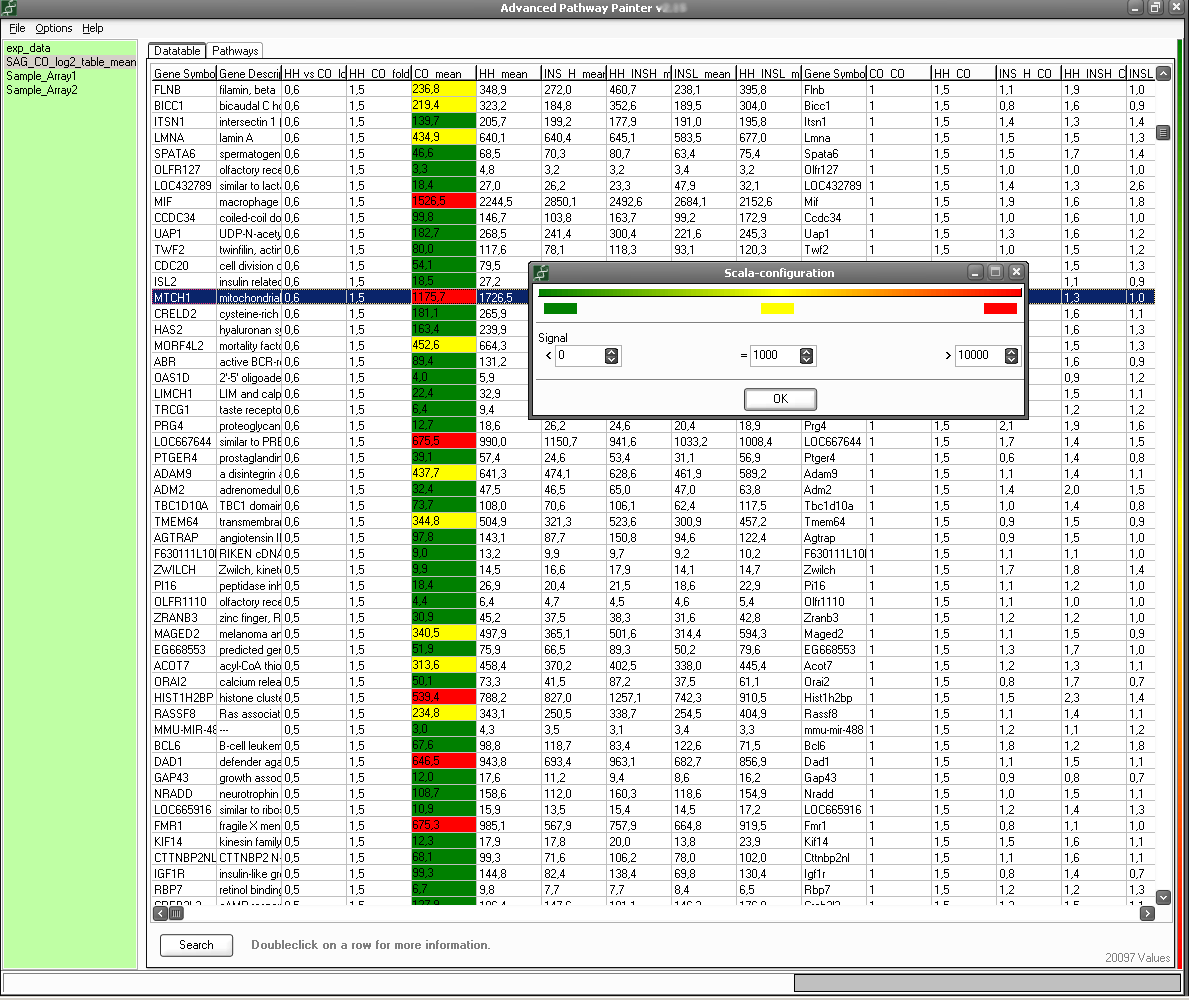
Table view
APP presents the data in different colors for each signal, so you have a quick overview of the data.
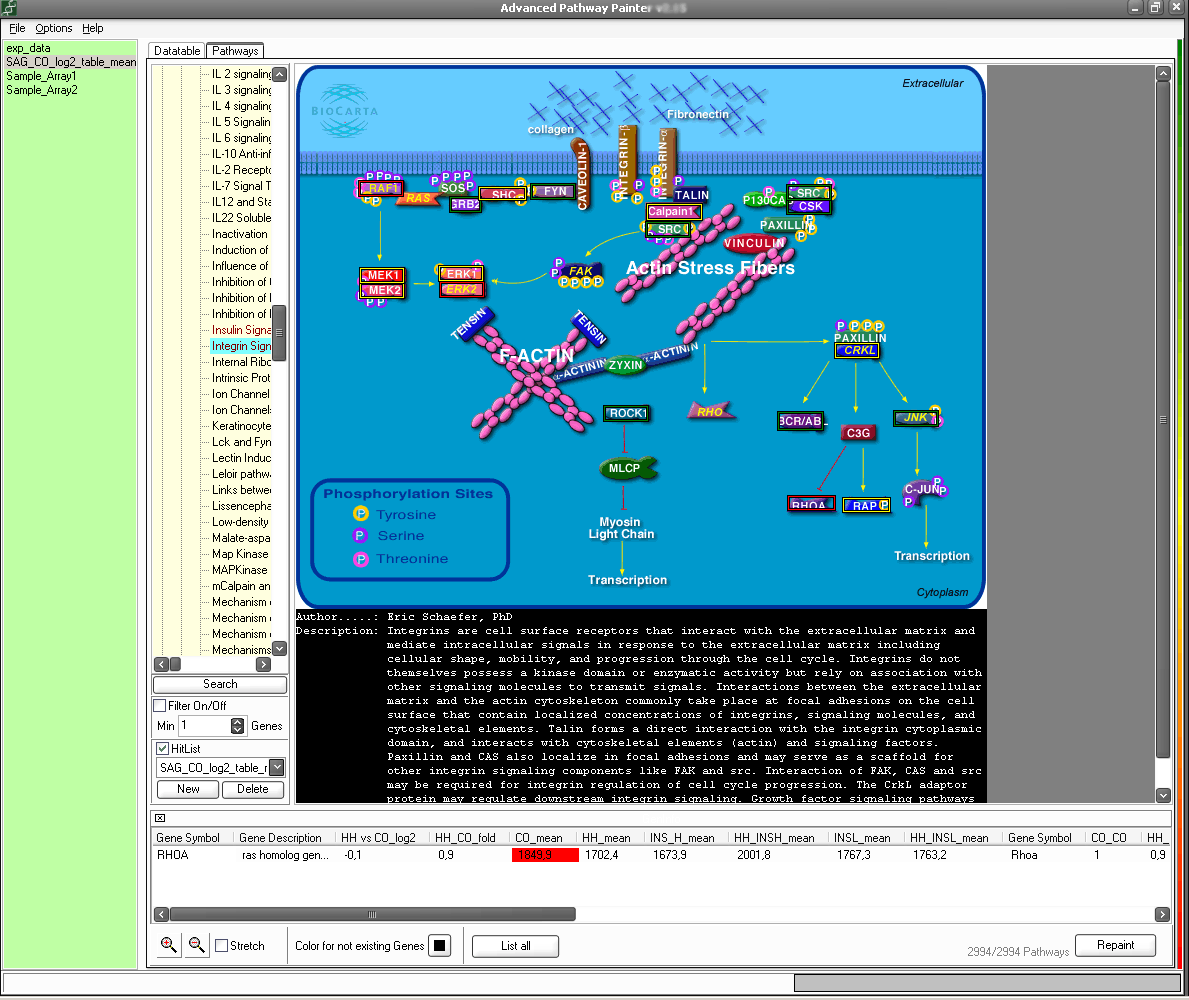
Pathways with gene expressions
This screenshot shows a loaded pathway which is directly combined with the data you have loaded.

